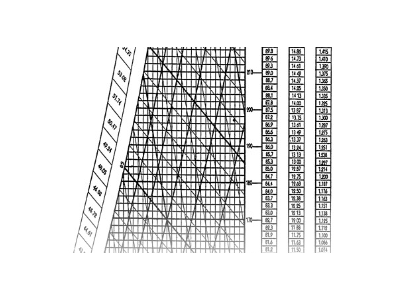
How do I read a psychrometric chart?
A psychrometric chart is a graphical representation of the psychrometric properties of air. It is used extensively by those in the fields of heating, ventilation, air-conditioning, and refrigeration (HVAC/R), and also in other fields like meteorology and agriculture. The chart plots the properties of air, such as temperature, humidity, and dew point, among others, and can be quite complex to understand without proper training.
Here's a simplified guide on how to read a basic psychrometric chart:
Dry-Bulb Temperature: This is typically represented on the x-axis (horizontal axis) and corresponds to what we think of as normal air temperature, measured by a thermometer freely exposed to the air but shielded from radiation and moisture.
Wet-Bulb Temperature: This is measured along the saturation curve (typically a curved line that goes from the bottom left to the top of the chart). The wet-bulb temperature represents the lowest temperature air can reach through the evaporation of water.
Relative Humidity: These are the curved lines that arch from left to right on the chart. Each line represents a different level of relative humidity. The 100% relative humidity line is the same as the saturation curve.
Humidity Ratio (or Specific Humidity): This is typically represented on the y-axis (vertical axis) and indicates the amount of moisture (in grains or pounds) per pound of dry air.
Dew Point Temperature: This is where a line drawn horizontally from the humidity ratio intercepts the saturation curve. This is the temperature at which the air can no longer hold its moisture and condensation occurs.
Enthalpy: These lines are usually diagonally oriented from the bottom left to the top right of the chart. The enthalpy of a sample of air is a measure of its total energy content, including both the dry air and water vapor.
Volume of Dry Air: These lines are also diagonally oriented from the bottom right to the top left of the chart. They represent the specific volume or the total volume occupied by the dry air and water vapor mixture per unit mass of dry air.
To use the psychrometric chart, you would typically know or measure two properties of the air (e.g., dry-bulb temperature and wet-bulb temperature), then locate the point on the chart where these two values intersect, and from that point, you can read off the other properties of the air (e.g., relative humidity, dew point, etc.).
Remember, reading a psychrometric chart can be complicated if you're not familiar with it. It's recommended to have a good understanding of thermodynamics and the properties of air, or to get a tutorial or training from someone who does, before using it for practical applications. We can help, if you have questions give us a call.


